BLOG
Consolidating the future of the NHS
Consolidating the future of the NHS
The NHS England planning guidance was published at the end of March, and the key word in the document is…
READ
Why introducing a productivity approach in local government would benefit both councils and citizens
Despite the pressures of austerity, a statutory obligation to balance the books and a rise in demand for services, local government has achieved a lot over recent years. Unlike other parts of the country’s political landscape which have shouted for more central funding – from the defence industry to the NHS – local politicians and officials have by and large played the hand dealt to them and have kept services going for vulnerable adults needing social care packages, for children placed into the care of the state, for maintaining streets and handling recycling, and for coping with the nation’s housing crisis. There are notable exceptions of course, and when things go wrong the impact can be calamitous for the individuals involved. But the majority of councils have done more than just keep the lights on.
That said, Leaders in local government are holding a very poor hand. They are the only part of the public sector with a legal requirement to deliver a balanced budget every year. They cannot spend more than they have yet they are not in control of the amount of money they can raise. Central government gives them most of their annual budget through direct grants; the small amount they can raise in local taxes is essentially capped; and other income (mainly charges and fees) is heavily regulated.
There is a democratic buffer zone between national politicians and local politicians so MPs and Ministers have someone else to blame if local services are poor. And the sector is – by its nature – fragmented, so it is not very good at lobbying government, or creating a coalition of public support for change.
When the national austerity squeeze came, it was not surprising that it bit most viciously in local government. If national politicians want to cut spending, local government is politically and operationally the easiest solution. Because of the legal requirement to balance budgets, local government has delivered savings every year while still delivering services. And with perverse but inevitable logic, it still remains the easiest option for national politicians.
It is inevitable that in these circumstances much of the discourse between local and central government is a version of Oliver Twist’s hungry plea of ‘please, Sir, I want some more’. Local government does need more money in the medium term – demographic trends mean that adult social care in particular is underfunded. But this issue clouds a bigger concern.
The focus on the amount of money that councils receive means leaders are not focusing sufficiently on how the money is best spent. This does not mean ‘service efficiency’. It means analysing productivity – how much value has been generated from this public investment, and what is the yield? For example:
Because the focus of the argument has been on spending and economic efficiency, the local government sector has not articulated what ‘good’ looks like. In other words, it has not defined the standard of outcomes it is striving for, or identified which investments give the best possible trade-off between spending and outcome improvement – which makes it harder to fight against funding cuts.
The sector needs to focus on productivity so that it can answer these questions. Public services should be about making people’s lives better, and improving productivity produces better outcomes at a reduced cost.
Having less money concentrates the mind. What is absolutely essential? Can I get better deals for what I need to buy? What can I cut and still survive? Can I do more? Can I get more out of myself and my team?
In the private sector, these decisions are much simpler. You can measure the value of what you’re producing by the price you can charge. This reduces all your inputs, investments and innovation, and outputs and outcomes, to a single point measured in pounds and pence. This helps to compare options measured against competitors.
In the public sector, these decisions are harder. The absence of the price mechanism means that what good looks like is in constant dispute. Each organisation makes their own choices every year – a series of compromises balancing politics, fine judgment, financial limits, behaviour of partners and delivery risk.
What does this mean?
The local government sector therefore has a huge productivity problem – and a huge opportunity.
IMPOWER’s pioneering work on demand management over a number of years has highlighted that when attention is properly paid to improving outcomes, there are real opportunities to improve people’s lives and save money.
For example:
A focus on applying sticking plasters means that the sector has not spent enough time preventing failure or improving outcomes. Councils have not been able to develop the leadership skills, performance metrics or interventions required for effective and sustainable change.
One example of fetishising failure in this way is Ofsted, the regulatory body for standards in education and children’s services. Local councils can be rated ‘good’ by Ofsted, yet still have too many children being taken away from their parents. This happens when a council’s children’s services are considered safe for children even if, overall, prevention of family breakdown is not working effectively.
IMPOWER’s research has shown that a negative Ofsted judgement on a local authority’s children’s services department, particularly under the Single Inspection Framework, can undermine its purpose to protect children and improve their life chances. A focus on managing the consequences of failure distracts increasingly scarce management time away from improving outcomes – which takes more time to deliver, is more complex to achieve, and can only be delivered by working across traditional organisational boundaries. Such a focus is deeply debilitating to system leaders, stifles innovation, and is worse for children’s outcomes overall.
Despite the challenges, some local authorities are managing to outperform their peers, achieving better outcomes for less money. To measure this, we developed the IMPOWER INDEX, which helps local authorities understand their performance in a new way.
Other measurement systems are focused either on pure outcomes (which are interesting, but don’t help operationally, and are not linked to investment – for example an academic definition of wellbeing or happiness) or on efficiency (unit costs and spending) in isolation from performance.
Instead, the INDEX defines productivity as outcome value per pound spent. It measures performance against outcomes (per pound invested) through six different lenses: children’s social care; older people; all age disability; health and social care interface; housing and homelessness; and waste and recycling. Each council is scored for productivity through each lens and is ranked accordingly.
We first shared IMPOWER’s Top 10 list of the most productive councils in December 2017. Councils in this list had achieved greater than average outcomes from a less than average spend per head. The list revealed an interesting mix of different types of authority from different parts of the country and demonstrated that it is possible to be the best even if demographics are against you.
Since then, we have further refined some of the outcomes measures for each of the six lenses, taking into account dataset availability and discussions with the leadership teams of more than 40 councils.
Drawing on 30 publicly available datasets, the INDEX ranks 150 councils using 49 outcome indicators.
These include:
The INDEX enables us to answer, pound for pound, which councils are spending their money most effectively and getting the best outcomes for citizens.
Using the latest updates (as at October 2018), we have included 3 ranking tables in this report: Top 10 most productive councils, Top 10 productivity rankings across the six lenses, and Top 10 most improved councils.
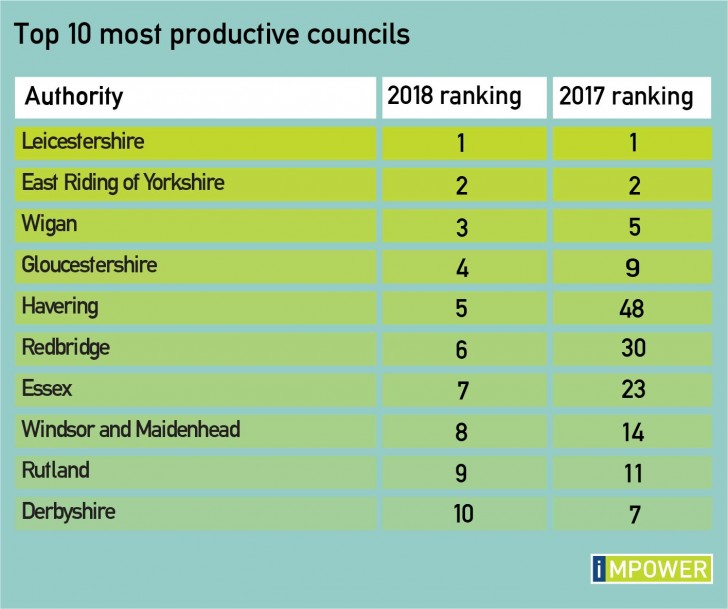
Leicestershire and East Riding of Yorkshire retain their 2017 positions as the most productive councils in England. Wigan, Gloucestershire and Derbyshire have also stayed in the Top 10. There are also five newcomers in the list, with Havering and Redbridge having made the most progress to claim their spot.
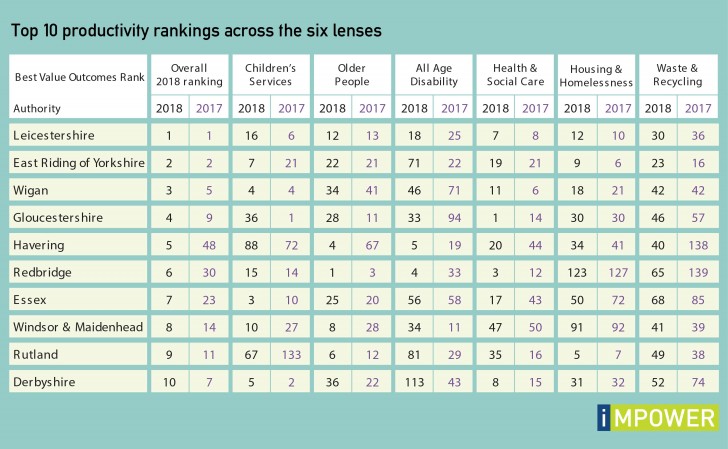
There are significant variations in performance within individual authorities. For example, Redbridge is the most productive council in England in relation to services for older people, but ranks 123rd out of 150 for housing and homelessness. This is because, relative to other councils, Redbridge has a high number of people living in temporary accommodation, a high number of people sleeping on the streets, and has built a low number of affordable housing units.
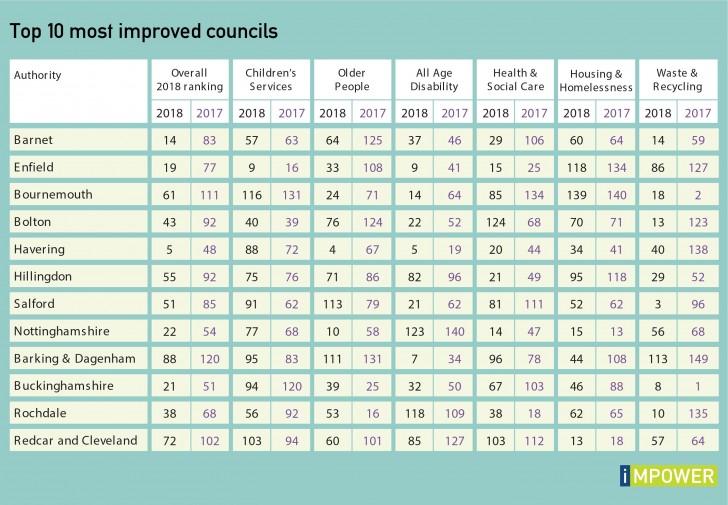
We categorise those councils which have increased their productivity ranking by more than 30 places to be ‘most improved’. Those that have improved the most overall are those that have made improvements across the board, and those whose performance has declined have generally fallen back across three or more areas. A notable exception is Rochdale, whose substantial increase in productivity in waste and recycling has placed them in the Top 10 most improved councils, despite declines in most other areas.
We wanted to check if there was a correlation between a council’s financial grip (the difference between budgeted and actual spend) and overall performance on the INDEX. Using budget and outturn data for 2017-18 as the most recent publicly-available comparative data, we found:
Asking which councils are best is a simple question, but one which isn’t generally asked or answered.
Being able to answer this question would help save local government from further effective bankruptcies. Indeed, it is rumoured that several more councils are likely to go the way of Northamptonshire over the coming months. Citizens also need to ask if the money that local government does receive is being spent well. They are paying increasing amounts of council tax for increasingly reduced services and should reasonably expect quality outcomes for local services, as they do for national services or private transactions.
The current lack of focus on outcomes is letting service users down, many of whom are amongst the most vulnerable in our society. It also puts local authorities under unnecessary budget pressures. Introducing a productivity approach with league tables ranking councils’ performance would improve decision making in local government, therefore getting superior results from whatever money is available.
For more information on the INDEX, please email enquiries@impower.co.uk
Read more related content from across the site, including in-depth reports, project case studies and articles.
Sign up for our newsletter here