I was not surprised that the NAO’s ‘Local Auditor Reporting in England’ report (released last week) focussed on value for money. Concerns that the nation’s local public services are not being spent fully in line with value for money principles have been widespread and talked about in conference room corners and Councils’ corridors for a number of years. So much so, in fact, that the Ministry of Housing, Communities and Local Government (MHCLG) has also signalled a desire to address the issue and is now developing a ‘continuous improvement tool’ which raises questions about the effectiveness of Peer Reviews in the process.
It is therefore timely that the NAO has shone a spotlight on the 22% of public bodies whose accounts have been qualified for value for money, and that they recommend that all local authorities adopt a consistent and standardised approach.
Of course, no-one thinks that all local authorities are equal and that all variation is bad. Demographics, economics and other factors can explain a lot. But there is no question that the degree of variation is unjustifiable. And as – through devolution of responsibility – priorities and spending decisions should be set locally, arguably performance should be judged against local measures. As a localist I can’t argue with that view.
However, like many working in the sector, I also believe in delivering the best possible public service outcomes for every pound that is spent. To do that, council leaders must understand the landscape in which they operate and be open minded about learning from the innovation and achievements of others. Crucially, value for money isn’t about efficiency, but about maximising outcomes.
Since the demise of the Audit Commission, there is not central framework for comparing performance. That’s why we built the IMPOWER INDEX: a tool that allows authorities to compare the outcomes they are getting per pound spent. It compares performance within and across England’s 150 local councils, from housing and homelessness to waste and recycling, and from adult social care to children’s services. It shows inexplicable variation even when demographic and other factors are taken into account. For example, the following chart shows variation in outcomes across local authority departments of children’s services:
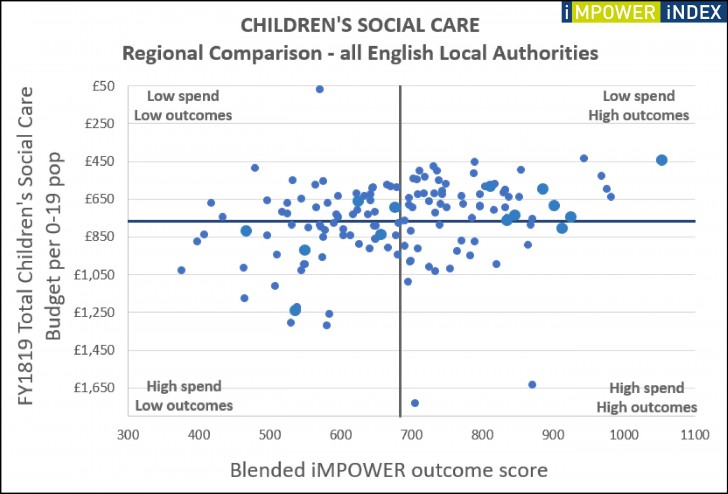
The INDEX has already helped a significant number of senior management teams understand their councils’ performance through a different lens, and then to shape new strategies where better outcomes cost less. They have done so by learning what their neighbours and peers have done to effect better outcomes at lower costs.
This discovery mindset takes guts. It’s hard to admit that others might have better or smarter ideas. But taking action to address regional variation in public services’ outcomes is vital before MHCLG decides that it is an excuse for yet more cuts.
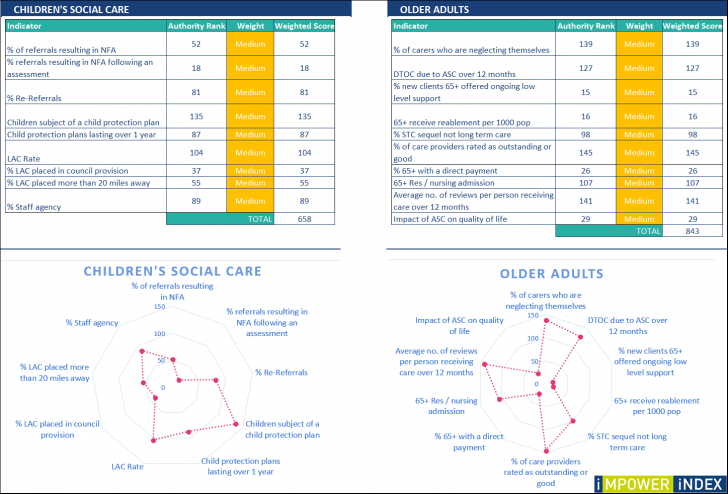
The Top Level INDEX ranks council productivity, examining performance through six lenses:
- Children’s Social Care
- Older Adults
- All Age Disability
- Health and Care Interface
- Housing and Homelessness
- Waste and Recycling
Each lens has 6-10 outcome measures, drawn from publicly-available data sets.