
BLOG
Hewitt review: the case for ‘glaziers’
Hewitt review: the case for ‘glaziers’
We are pleased to see three key themes coming through loud and clear in the Hewitt Review.
READ

Use the IMPOWER INDEX to see how your local authority is performing against five criteria
The pressure to crack the serious issue of Delayed Transfers of Care (DTOC) is relentless – and is reminiscent of when hospital Accident & Emergency targets were introduced in 2004. Over the last month, Councils and health professions have been sent letters demanding performance improvements linked to iBCF funding conditions as well as the CQC announcing their next round of Local Area Inspections.
The letters that Health Secretary Jeremy Hunt and Communities Secretary Sajid Javid sent to poorer-performing councils in early December suggested that the Department of Health and DCLG are holding councils accountable to five criteria, namely whether they:
1. hit their DTOC social care expectations for September 17;
2. improved their performance since September 2016;
3. improved their performance since February 2017;
4. are in the bottom quartile for social care DTOC rates for adults per 100,000 population; and
5. have a DTOC social care rate at or below 2.6 per 100,000 population.
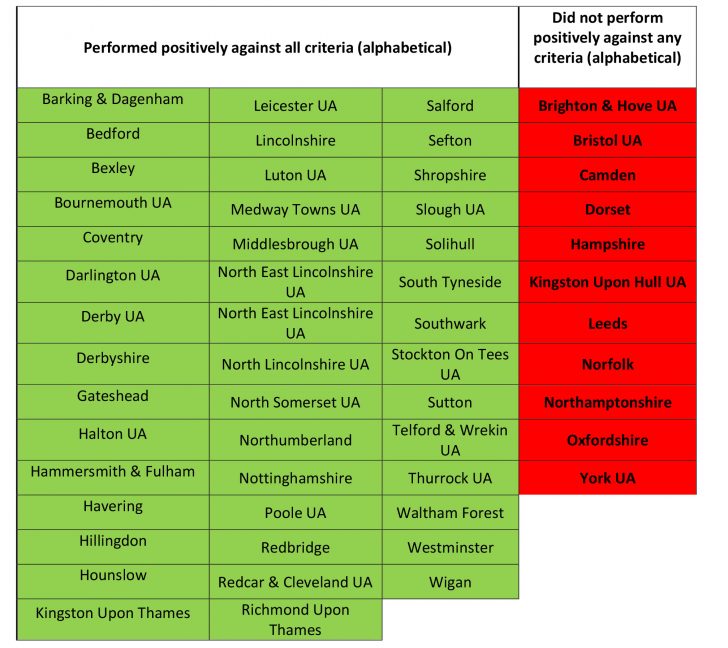
We have incorporated these criteria into the DTOC module of the IMPOWER INDEX, our tool for evaluating local authority performance. It shows that 44 councils performed positively against all the above criteria, and that 11 councils did not perform positively against any of them:
Our analysis of the latest NHS England figures shows a clear improvement of over 5% in the DTOC rate attributable to social care in each of September and October 2017. This is encouraging, and it is possible that the money released through the Improved Better Care Fund (iBCF) is starting to make a difference.
However, even if this rate of improvement is maintained, it will take at least another year to hit the Whitehall-set target for the social care element of the DTOC goal. And at the start of winter, there are of course additional seasonal challenges which may affect the rate of improvement.
The picture of DTOC attributable to the NHS is also less rosy, with an improvement of just 1% over the same period.
It is of course true that a performance table cannot show the whole picture. Each of England’s 150 local authority areas face different challenges with very different population needs, infrastructure and services. That is why we have established the IMPOWER Collaborative, so that we can accelerate our understanding of best practice.
If we are to reach the national target, it is crucial that we learn from what is working.
Check out our analysis of the September figures, and get in touch to learn more.

Sign up for our newsletter here