
BLOG
Hewitt review: the case for ‘glaziers’
Hewitt review: the case for ‘glaziers’
We are pleased to see three key themes coming through loud and clear in the Hewitt Review.
READ
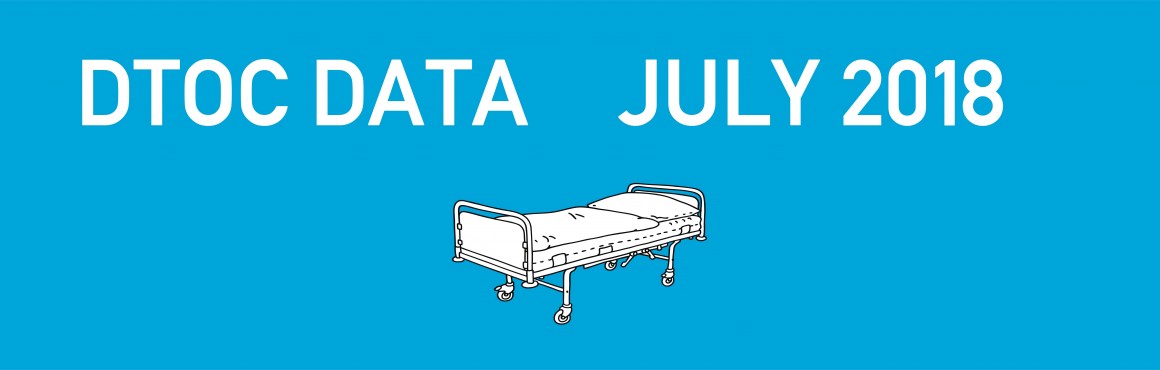
Progress on Delayed Transfers of Care (DTOC) from hospitals continued to stall between June and July, according to the latest monthly figures from NHS England. The overall number of delays moved only slightly, rising by 0.35%. Delays attributable to local authority departments of social care were up by 2%, with delays attributable to the NHS down by 1.3%.
However, those working on the issue should be patting themselves on the back when they read these statistics. Because of the summer heatwave, emergency admissions between June and July were 4.3% higher than the same period in 2017 – and higher than in any of the winter months over the last two years. The fact that this additional pressure didn’t result in an equivalent increase in DTOC is indeed worthy of praise.
There are now 81 Local Authority Areas hitting target – four more than the previous month. And in total, 124 authorities have made improvements since February 2017. But winter is looming, and it seems that this level of progress is not enough for the Government, who are continuing to apply pressure for further improvement.
One way that performance is being monitored is through the recently updated NHS Health and Care Interface dashboard, which ranks individual Local Authority areas against a range of metrics:
While the individual metrics are in themselves useful, there are two key points to bear in mind:
Another round of targeted area reviews of the interface of health and social care have also been announced: Leeds, Reading and Staffordshire are all having a first review from the Care Quality Commission, whilst Stoke, York and Oxfordshire are having follow ups. Two of the three who are having new reviews (Leeds and Staffordshire) have had extra funding given to them to support development since the last set of reviews. It is perhaps unsurprising that these two are being scrutinised as both have fallen down the performance rankings on the dashboard. Leeds have fallen from 92 to 134, while Staffordshire have fallen from 119 to 135.
In comparison, Reading have dramatically reduced their number of DTOC days. They are now hitting targets in all areas and have improved their overall ranking on the dashboard. A period of poor performance earlier on in the year could have led to the inspection (a problem with not looking at the latest data and using the yearly average when the targets are set on a single month?).
To see how your local authority is performing on DTOC, or to look at DTOC days and emergency admissions in your local health Trust, download the IMPOWER index.

Sign up for our newsletter here