We define productivity as outcome value per pound spent. This enables us to understand which councils are spending their money most effectively and getting the best outcomes for citizens.
Which councils are best?
Our report examines outcome productivity - the value that councils achieve for every pound that they invest
Introduction
We are delighted to publish our 2019 ‘Which Councils are Best?’ report. This annual report, with a list of the Top 10 most productive councils in England, has become the most widely-read evaluation of council performance. For some, it is an eagerly-anticipated moment in the local government calendar. Many councils are keen to understand where they are on the list and why. Those who make it into the Top 10 are usually quick to celebrate – and rightly so.
Our commitment
We are pleased with this positive response. The whole purpose of developing the INDEX is to help the sector reframe what ‘good’ looks like by taking publicly-available outcomes data and looking at the value that councils are driving in delivering local public services for every pound they invest. Once we have a benchmark, we can learn from the best and celebrate their success. Our continued commitment is that:
- We will not publish the whole list – or even just the bottom 10. We are not interested in naming and shaming. Our intention is to encourage improvement and learning through celebrating the best the sector has to offer.
- We will continue to make ongoing improvements to the way we measure performance. While we value consistency in year-to-year measurement, we are not holding ourselves to an unnecessary academic standard. It is more important that we improve our insights as more, different or better data comes to light. We will always be transparent, but a small number of measures will change.
- We will not charge councils to access their own data. Any council that wishes to get a personalised download of their own data from the IMPOWER INDEX just has to ask.
Contents
Published: November 13, 2019
Download PDFDelivery not data
Our team of consultants spend their days working at the front line of public sector change, helping our clients make a positive impact on outcomes while managing resourcing challenges and responding to austerity. We use ‘Which Councils Are Best?’ and the IMPOWER INDEX as part of our diagnostic and delivery work; it is not just an interesting data tool. We use data to help our clients frame the right questions to ask. We never draw conclusions from data alone.
Indeed, we find that a lot of data is collected at national and local levels but never used. We therefore help our clients collect the right type of data to give true insight into what is really going on within their complex systems. This usually means collecting different data – and less of it. While many of us at IMPOWER are proud to call ourselves data geeks, we do not think that working in the public sector data should require an engineering degree. Public service systems are highly complex, but the actual maths involved in analysing data isn’t really very difficult and anyone who tells you otherwise is selling something you don’t need.
Cutting through complexity
In our book The EDGEWORK Manifesto, we make the case both for a new approach to public sector leadership and a new approach to consultancy.1 The culmination of 20 years of working within the public sector, the book explores why smart, dedicated and experienced public sector leaders find it difficult to make measurable and sustainable improvements within their systems. We argue that people in leadership roles facing challenges and change often incorrectly define the problem they are seeking to resolve and therefore reach for the wrong solution.
One reason for getting it wrong is that both public sector leaders and their consultants are designing solutions for complicated problems, rather than complex ones. The difference between complicated and complex is not one of degree but of type. Solutions which do not take this into account are prone to fail – if not in the short-term, certainly in the medium term.
Many people respond to this challenge by narrowing down their focus to measure something very specific. But we have gone the other way and widened the lens. Only by looking at a broad range of outcome measures and by aggregating spending can we approximate the complex systems being run by local authorities. This EDGEWORK approach makes our analysis of productivity particularly powerful, because it shows that despite this complexity some councils are significantly more productive than others, and are able to achieve better outcomes for their citizens while also spending less money.
What does 'good' look like?
Traditionally, the focus of the argument on relative performance has been to look at economic efficiency (ie lowest unit cost; ‘the cheaper the better’). The local government sector has not been able to agree on one definition of what ‘good’ really looks like, including for users of council services. In other words, it has not defined the standard of outcomes it is striving for or identified which investments give the best possible trade-off between spending and outcome improvement. This makes it harder for the sector as a whole to fight against funding central government funding cuts.
The sector needs to focus on outcome productivity so that it can answer these questions. Public services should be about making people’s lives better, and improving productivity produces better outcomes at a reduced cost.
The public sector productivity problem
Having less money concentrates the mind. What is absolutely essential? Can I get better deals for what I need to buy? What can I cut and still survive? Can I do more? Can I get more out of myself and my team?
In the private sector, these decisions are much simpler. You can measure the value of what you are producing by the price you can charge. This reduces all inputs, investments, innovation, outputs and outcomes to a single point measured in pounds and pence. This helps to compare options measured against competitors.
In the public sector, these decisions are harder. The absence of the price mechanism means that what good looks like is in constant dispute. Each organisation makes their own choices every year – a series of compromises balancing politics, fine judgment, financial limits, behaviour of partners and delivery risk.
What does this mean?
- Benchmarking on ’what good looks like’ isn’t possible because there is no nationally-agreed definition of ‘good’ outcomes. It is therefore not possible to make comparisons between councils or approaches.
- Comparable data is only gathered for things which are easily measurable (usually efficiency or unit cost metrics).
- Innovation tends to happen locally and is not shared across the sector effectively.
- In the absence of confidence in what good looks like, the narrative veers towards a narrow-framed argument about how much is being spent.
The local government sector therefore has a huge productivity problem – and a huge opportunity.
IMPOWER INDEX
Despite the challenges, some local authorities are managing to outperform their peers, achieving better outcomes for less money. To measure this, we developed the IMPOWER INDEX, which helps top-tier local authorities understand their performance in a new way.
Other measurement systems are focused either on pure outcomes (which are interesting, but don’t help operationally, and are not linked to investment – for example an academic definition of wellbeing or happiness) or on efficiency (unit costs and spending) in isolation from performance.
Instead, the INDEX defines productivity as outcome value per pound spent. This enables us to understand which councils are spending their money most effectively and getting the best outcomes for citizens.
It measures performance against outcomes (per pound invested) through seven different lenses: children’s social care; children with high needs; older people; all age disability; health and social care interface; housing and homelessness; and waste and recycling. Each council is scored for productivity through each lens and is ranked accordingly.
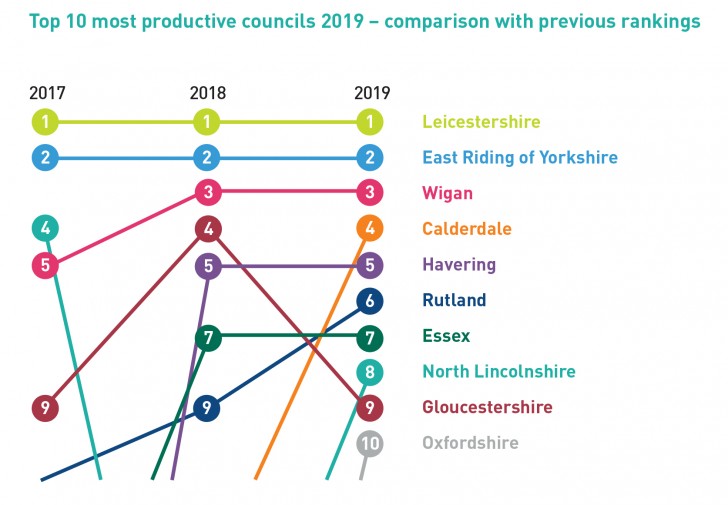
We published our previous lists of the Top 10 most productive councils in 2017 and 2018, and it is still the case that different types of authority from different parts of the country can be among the best even if demographics are against them.
Since publishing the 2018 list we have further refined some of the outcomes measures for each of the lenses, taking into account dataset availability and discussions with the leadership teams of more than 40 councils.
Our list of datasets has grown from 30 to over 40, and we have also added a seventh lens. Given the merger between the unitary authorities of Bournemouth and Poole with the non-metropolitan district of Christchurch, our Top 10 is now drawn from England’s 149 top tier councils, excluding the City of London and the Isles of Scilly. As with previous years, all counties are treated as county unitaries through the aggregation of district-level outcome and budget data.
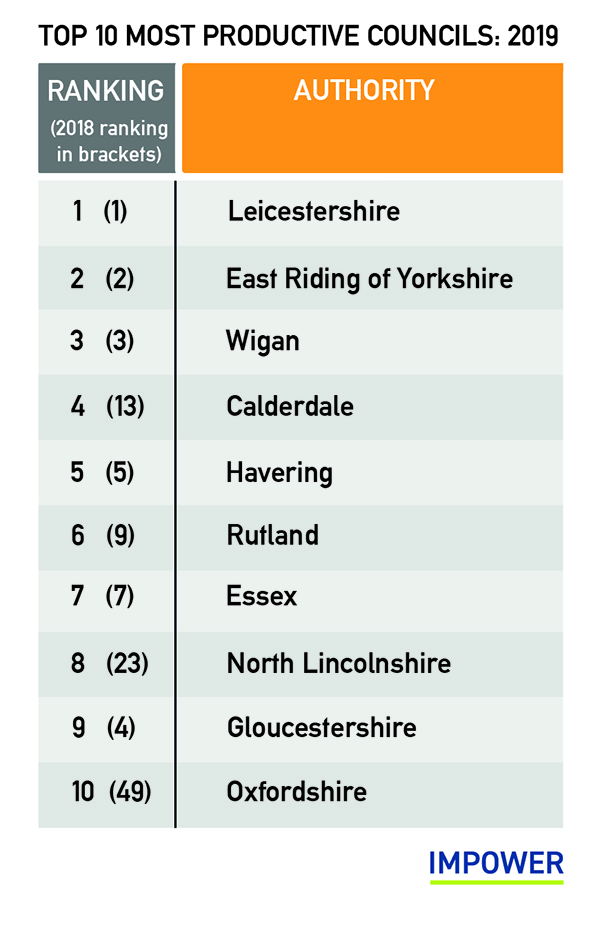
2019 Rankings
Leicestershire and East Riding of Yorkshire have retained their positions as the most productive councils for the third year running. Calderdale has moved into fourth place, steadily progressing from being 17th in 2017 and 13th in 2018 to featuring in the Top 10 for the first time. Oxfordshire is the other newcomer to the Top 10, and North Lincolnshire is back after being ranked 23rd last year. Rutland has improved its position; Wigan, Havering and Essex have maintained theirs, and Gloucestershire has slipped slightly while retaining its Top 10 status.
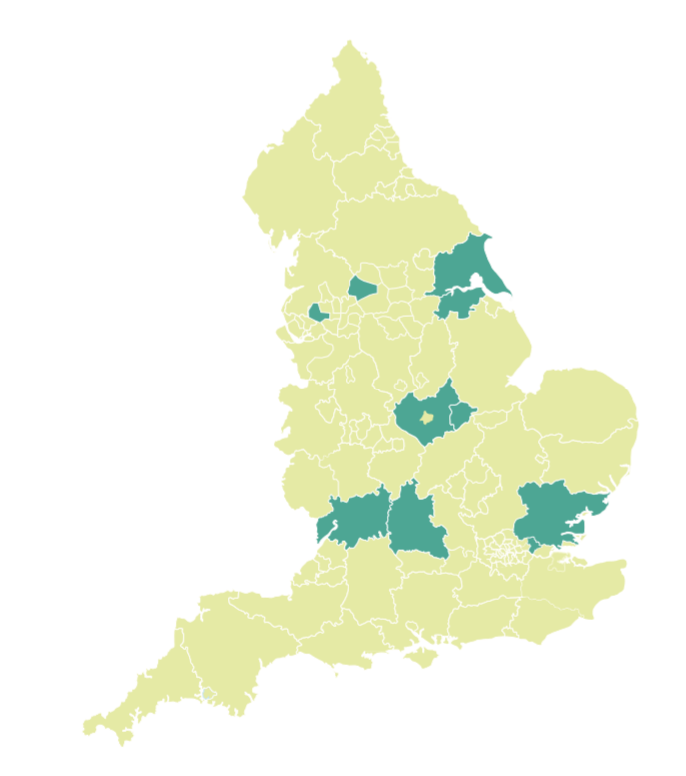
2019 ranking by region
Half of the Top 10 Councils are located in just two regions, Yorkshire & Humberside and East Midlands.
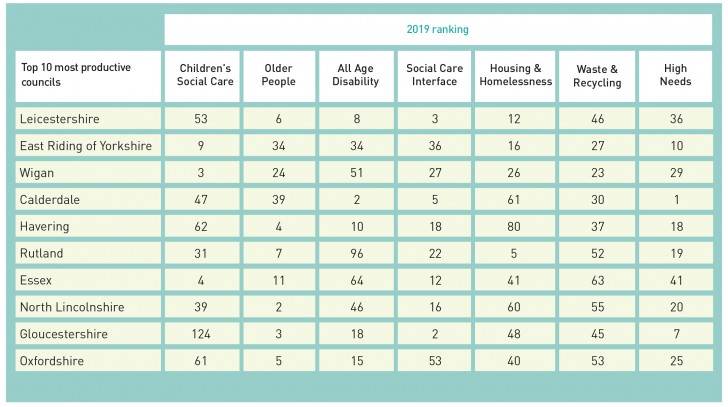
Top 10 productivity rankings across seven lenses
Across the seven lenses used to assess performance there are significant variations within individual authorities. For example, although Leicestershire is the most productive council overall, it ranks 53rd for children’s social care. This is because, relative to other councils, the council has a high number of referrals that result in no action. Gloucestershire has the largest range of variation, ranking 2nd for health & social care interface and 124th for children’s social care.
Calderdale’s overall ranking improvement has been boosted by a strong performance in the new ‘children with high needs’ lens. All of the Top 10 most productive councils, with the exception of Essex, rank in the top 25% of councils for outcomes for children with high needs.
Top 10 most improved councils
We consider those councils who have increased their overall productivity ranking by the highest number of places to be ‘most improved’. This year the most improved local authorities have all increased their overall ranking by 27 places or more. Those that made the most progress all improved their performance in at least half of the six original lenses, ranked well for the new high needs lens, and made improvements in the older people lens. The largest improvements took place in relation to all age disability, reflecting the increasing focus placed on social care outcomes by councils in recent years.
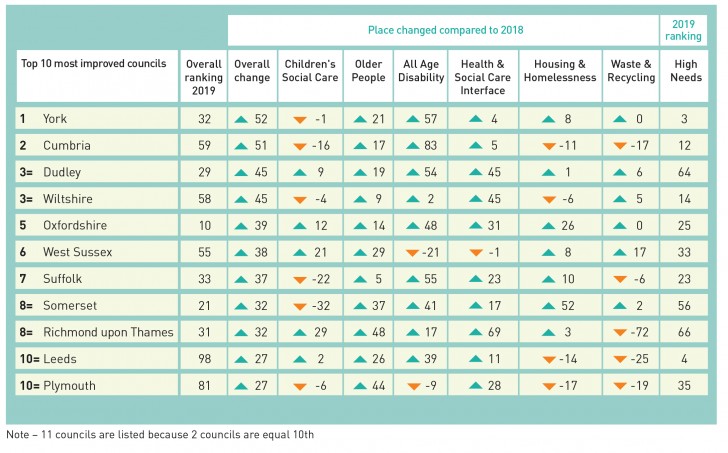
Three councils deserve a special mention for improving across all six original lenses: Dudley, Wolverhampton and Greenwich. Only four councils experienced a fall in performance across all six lenses.
Conclusion
For the third year, the IMPOWER INDEX has shown that there is no correlation between a council’s spending per person and the outcomes achieved. A high budget does not guarantee good outcomes for citizens, and many councils have proven that outstanding outcomes can still be delivered in the face of austerity. The councils that are the most productive or have improved the most are doing well in the areas that are causing the biggest financial pressure on local government, grasping the situation and creating value. We are publishing this analysis in November 2019, just a few weeks before a general election. As part of their campaigning, we can expect all major political parties to promise to invest in critical public services such as housing and education, to ‘fix’ social care, and to ringfence more money for the NHS. Understanding where, how and why the money that local government receives is spent well has therefore never been more timely or more critical.
Related content
Read more related content from across the site, including in-depth reports, project case studies and articles.
Newsletter
Sign up for our newsletter here